Open Roads: Vehicle Travel during the COVID-19 Pandemic
Open Roads: Vehicle Travel during the COVID-19 Pandemic
In New York City, where I live, the streets are empty and the highways are wide open. While essential workers are still driving to work, vehicle travel has largely evaporated in the face of travel restrictions and stay-at-home orders from coast to coast. The change is plainly evident, but just how much has travel decreased on America’s roads?
Data from the mobility analytics platform StreetLight sheds some light on this question. The company, which uses in-vehicle and cellphone location services to track driving, is currently offering a public data feed that tracks national vehicle miles traveled (VMT) by county over the course of the COVID-19 pandemic. As of this writing, data is available through May 1, 2020, and the data feed is continually updated with the latest VMT data.
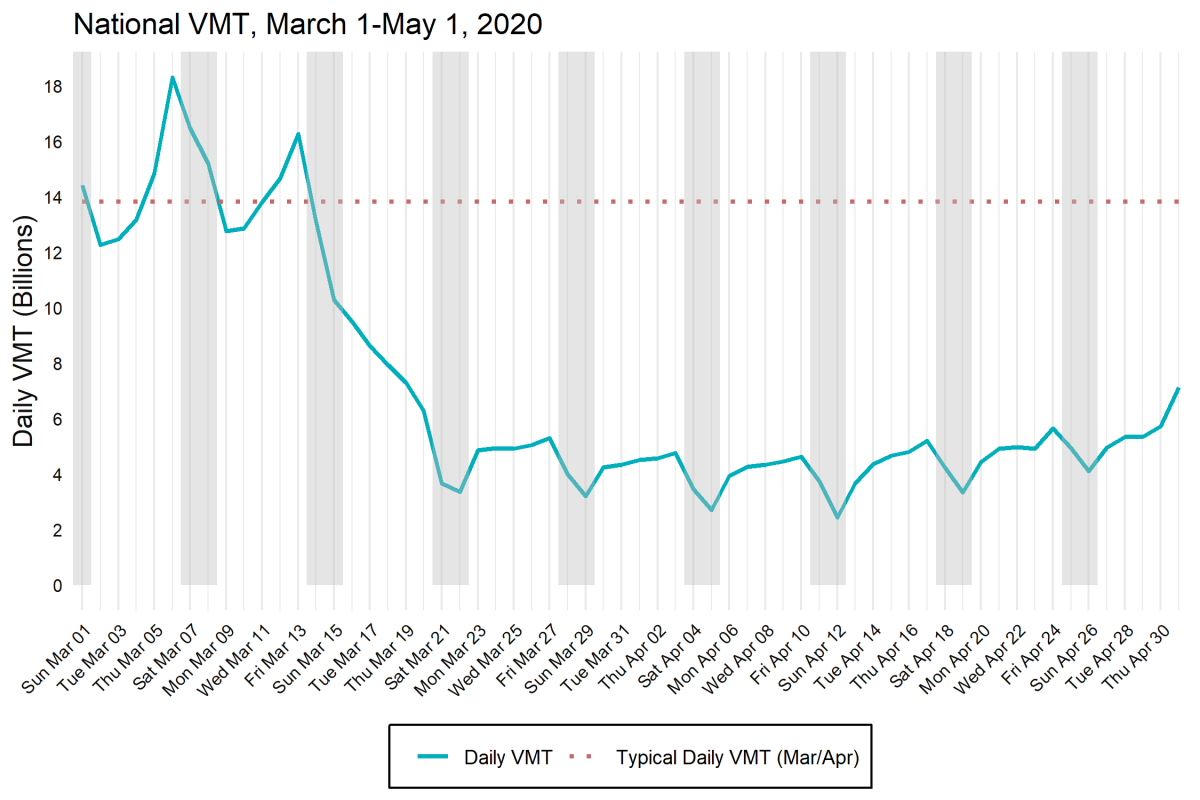
Looking at this data at the national level, it is immediately apparent that VMT is way down. On Monday, April 13th, for example, national VMT hit a recent weekday low of 3.7 billion,1 down about 70 percent from a more typical Monday figure of 12.3 billion miles driven on March 2nd. StreetLight’s data feed also provides another basis for comparison: average daily VMT for January 2020. However, people usually drive less in January, so I scaled this January baseline up by 11.6% to reflect the normal ratio of January VMT to March and April VMT shown in FHWA’s Traffic Volume Trends. Assuming that Americans normally drive about 13.8 billion miles daily in the spring months, I plotted this baseline against daily VMT during the pandemic in the figure below. While daily VMT has ticked up since mid-April, it is still about half of what we might expect under normal circumstances.
Naturally, this trend looks different in different parts of the United States. As the epicenter of the pandemic in the United States, New York City (where I also happen to be based) has seen declines in VMT that far exceed the national average. As shown in the figure below, vehicle travel began declining precipitously on March 13th (about one week ahead of the New York State on PAUSE order of March 22nd). VMT bottomed out on Monday, April 13th (at 15.1 million VMT) and has since been climbing slowly. That may sound like plenty of driving, but on a typical April day New York City would normally see about ten times as much VMT (about 148.8 million miles).
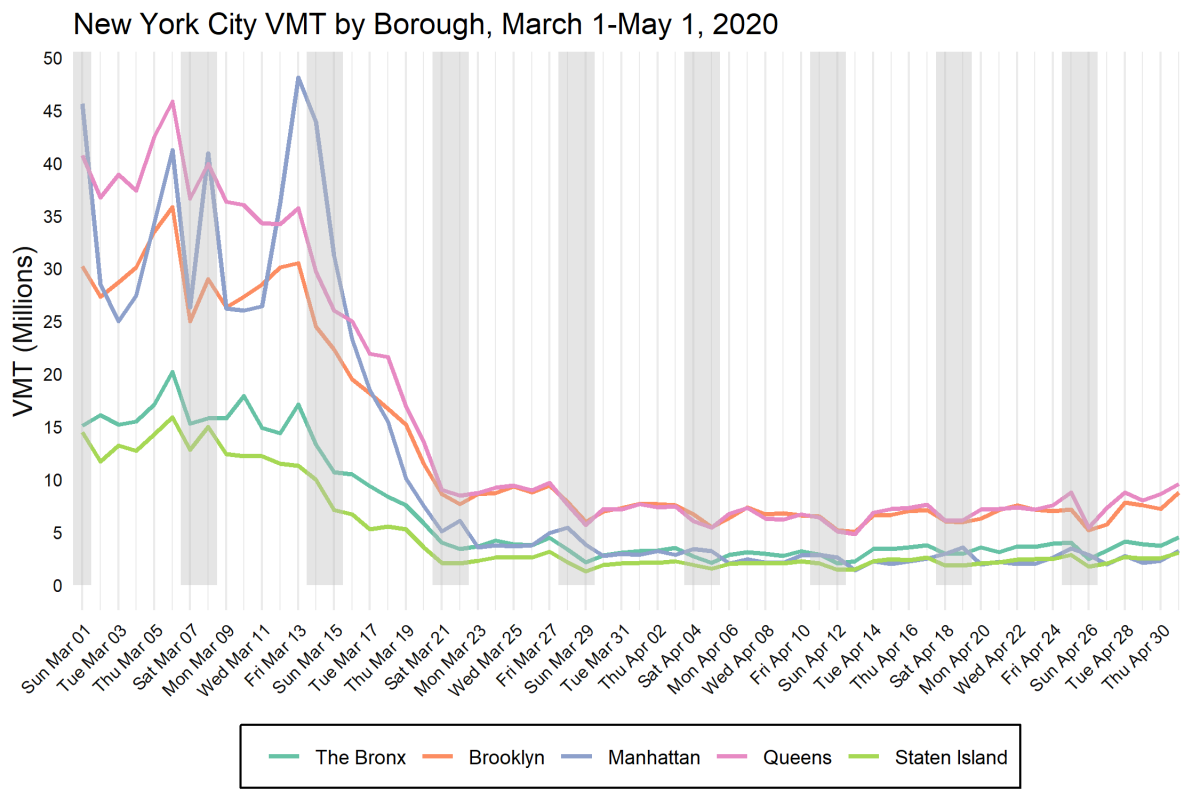
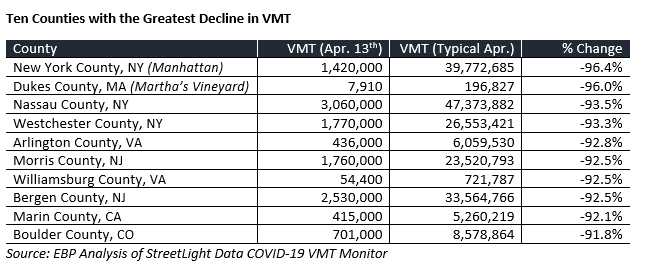
While travel has declined citywide, the sharpest drop-off is in Manhattan. The island saw a low of 1.4 million miles of travel on April 13th, compared with a typical April VMT of 39.8 million miles. In fact, New York County, NY (coextensive with the borough of Manhattan) has seen the most extreme decline in VMT of any county in the United States (measured as the ratio of typical March/April VMT to actual VMT on April 13th). Just the same, declining VMT is a regional phenomenon; of the ten U.S. counties with the most extreme decline in VMT, five are in the New York Metro Area (see table below). The other five counties in the top ten are either low-population vacation destinations (Martha’s Vineyard) or densely populated areas of major metropolitan areas with robust stay-at-home orders (Arlington, VA).
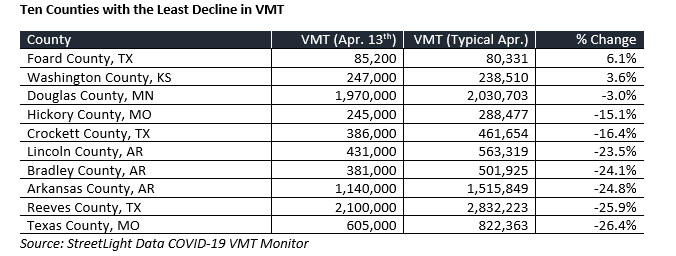
On the flip side of the equation, the following ten counties have seen the least change in VMT by the same standard. With the exception of a prison outbreak in Lincoln County, AR, none of these counties has had more than a handful of confirmed cases of coronavirus today (Douglas County and Arkansas County have had three and Bradley County eleven).
On a state-by-state basis, the states that have seen the most extreme drops in VMT are also those hardest hit by the coronavirus: New Jersey, Massachusetts, and New York. The states that have seen the smallest declines in VMT are Arkansas, Mississippi, and Alabama. While all states have seen declines in VMT and most are slowly returning to normal, the states with the least overall declines are also approaching their baseline VMT for this time of year more quickly. To illustrate this point, the figure below compares the two most extreme cases: New Jersey and Arkansas.
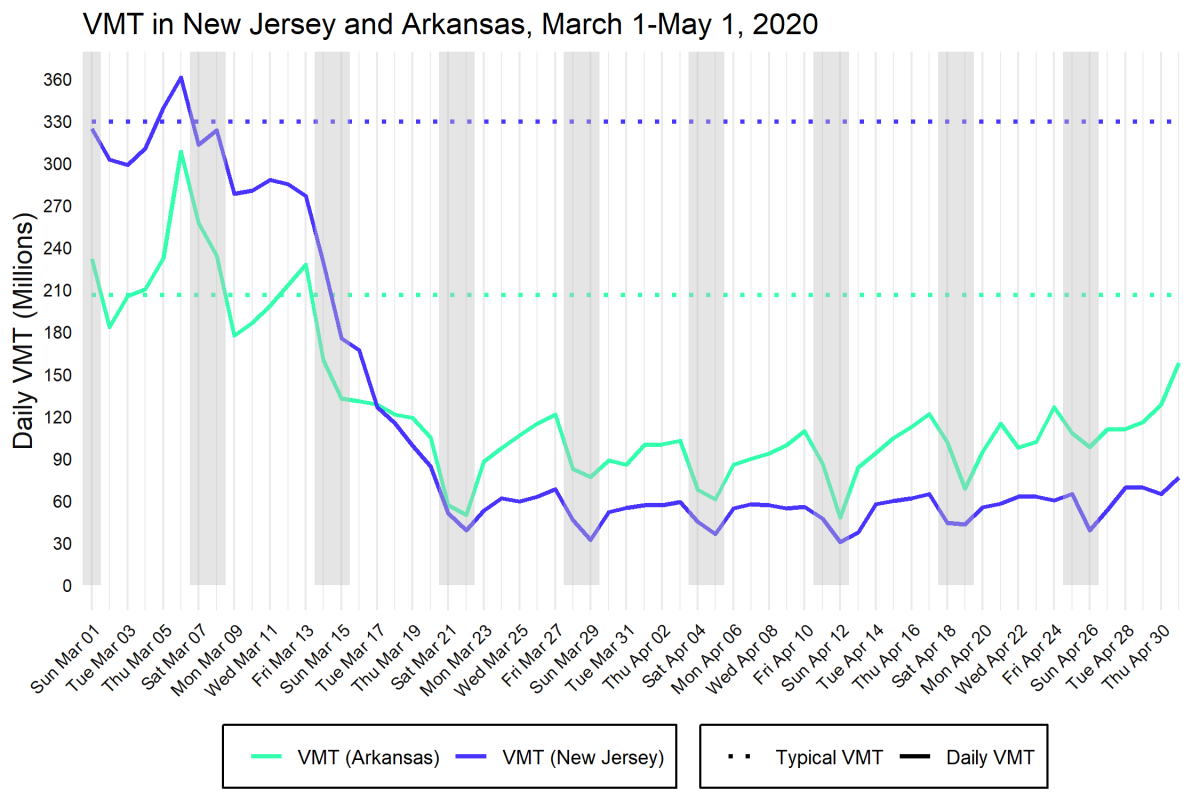
As states begin to lift their stay-at-home orders, it is reasonable to think that VMT will continue to rebound slowly. However, the rate of this rebound and the extent to which VMT reaches its typical levels remain as uncertain as the long-term outcomes of the pandemic itself. As my colleagues at EBP discussed in the recent Insights piece Transportation Economics and Planning for a Post-Pandemic Era, major long-term changes could include an acceleration of telecommuting, e-commerce, active transportation, declining air travel, and much more. Nonetheless, in the uncertain months to come, data like this can help planners understand the impact of newly open roads on fuel tax revenues, emissions, crashes, and other critical transportation performance metrics.
1. StreetLights methodology for estimating VMT can be found in their VMT Monitor Methodology and Validation Document.
