Tool Talk #1: Visualizing Travel Changes in 2020
Tool Talk #1: Visualizing Travel Changes in 2020

Here at EBP, we are starting a bimonthly blog series on “Shiny apps” we’ve been working on to show how specific data sets can be visualized and explored. Shiny apps are lightweight tools, typically serving a single function or illustrating a specific data series and often turning otherwise static charts into interactive maps or graphs that can answer questions and show subtle patterns.
One highlight of this flexibility is that we can scale the variables of interest to the just-right level of detail. For example, for the focus of today's blog, Travel Changes in 2020, I show how national trends in transportation play out on a state-by-state basis. Often, a single nationwide statistic would obscure important differences, but mapping these statistics by state can immediately show how varied the reality on the ground is between states. The implications of the changes are much better understood at the state level, where using larger averages as a shortcut to understanding trends could lead you astray if you want to think in any nuanced way about state-level policy. It doesn’t help a state DOT or regional MPO to know what is happening at the national level if it doesn’t match the trends in their state.
This is why our first featured tool shows two transportation patterns shifts at the state level between 2019 and 2020: the drop in vehicle miles-traveled (VMT) on highways and the fall-off in deplanements – i.e., people travelling to a state by air. The tool allows you to choose the variable of interest and click on a state to see the value for any month or a chart of the whole year compared to the US average.
Looking at VMT Changes Across States
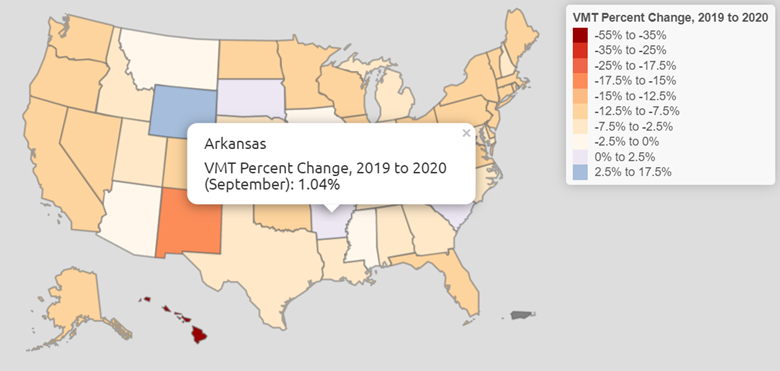
It's well known that people drove in far less in 2020 than they did in 2019, which means state DOTs were hit with reduced gas-tax revenues (a topic we explored in a previous blog post with earlier state-level VMT data). But the drop in VMT wasn’t the same everywhere in the US, as shown in this example map for September 2020, which was produced by the Travel Changes tool. The percentage changes in VMT varied across the country between September 2019 and September 2020, and the estimates for some states, like Arkansas, actually went up even as other states had experienced a relative drop.
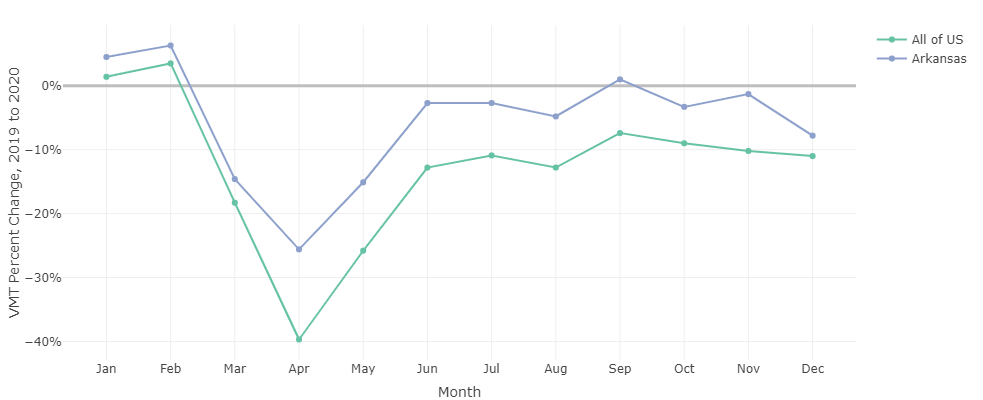
Switching over to the Chart tab shows how Arkansas compared to the entire nation through 2020. For most states, their percentage change from 2019 drops sharply in March and April then rebounds, much like the nation as a whole, though some states, like Arkansas, fared better than others.
Extending to Air Travel
The variable drop-down selector at the top of the tool allows you to choose another variable: Percent Change in Deplanements, 2019 to 2020.
Air travel dropped precipitously last year, and deplanements across the country in 2020 were roughly only half of what it was in 2019, but some states saw bigger drops in deplanements in than others. Deplanements include tourists, so for tourism-dependent economics this has enormous consequences. Which states saw the biggest drops? The local patterns are much more important than just knowing the national statistic.
Any tool like this works better by working interactively with it – click here or on an image above to see the full tool and let us know what you think, either at brandon.irvine@ebp-us.com or via our general e-mail, info@ebp-us.com.
Tags:
