Blog

Typically, access conveys movement – driving to a job, walking to a store, taking a bus to school. But in the coronavirus era, being able to participate in the economy without leaving the house has become paramount.
Tags:
#scenario planning

At the TRB Annual Meeting, I had the opportunity to publicize a project that I’m leading: TCRP J-11 (31) Guidance for Trading, Sharing, and Selling Public Transit Data – Now and in the Future. I have been talking to transit agencies and experts about data sharing and getting value out of the data transit agencies collect. We have discussed challenges, including data quality, standardization, and privacy.
Tags:
#TRB

About 85% of the U.S. population lived in cities in 2015 (Census FactFinder). These urbanites are subject to unique impacts of climate change, as highlighted by the Fourth National Climate Assessment, released in November 2018. The Climate Assessment provides an update on indicators of climate change, including rising average global temperatures, extreme high temperature events, and more frequent heavy precipitation. The 2017 Atlantic hurricane season was record-breaking with four high-intensity hurricanes (Harvey, Irma, Jose, and Maria). And rainfall associated with hurricanes in the Atlantic and eastern North Pacific is predicted to increase due to warmer temperatures. Some studies predict increased frequency and severity of thunderstorms across the United States. At the same time, sea level rise increases coastal flooding risks from weather events. More extreme and rising temperatures mean that in addition to flooding, drought and associated wildfires have also occurred in recent years, including the 2011-2017 California drought.
Tags:
#Resiliency

Spatial data is at the core of transportation analysis. Land use patterns, including the density of jobs and homes, and the locations of transportation infrastructure, such as stops, stations, and intersections, are frequently used to answer transportation planning questions. It is often useful to generate metrics at for a geographic zone. Not only does this allow for mapping and visualization, it often reflects the way that people use a transportation system – while a bus stop or rail station is located at a single point, passengers access it from the surrounding zone. In multi-modal analysis, considering zone-to-zone rather than point-to-point travel allows performance and accessibility assessments to compare or combine different modal options that serve the same areas.

Uncertainty was a common theme at at AMPO’s annual conference, held in September in San Antonio, Texas. It was an opportunity to share strategies for dealing with an uncertain transportation future, ranging from scenario planning to collaboration and data-driven and technical solutions.

The transportation ecosystem is changing rapidly. Individuals have new transportation options, and nationwide trends show transit ridership in decline. New technologies, such as automated vehicles, are expected to continue to reshape mobility in the future. In this environment, transit system owners and operators are seeking to adapt their network design and services. Improved data availability and new processing methods can identify ways to improve transit service.
Tags:
#transit
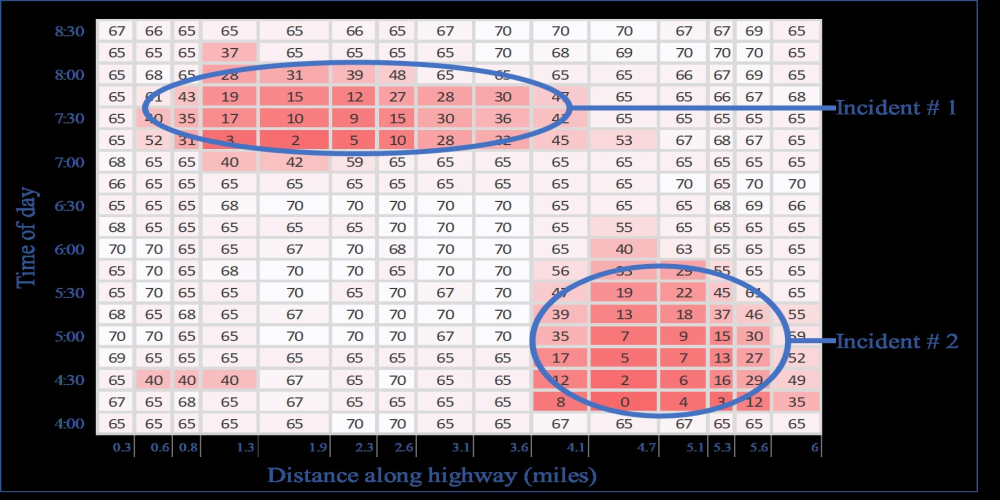
Highway link speed data from vehicle GPS probes has become the standard for performance measurement, available free to state DOTs through the National Performance Management Research Data Set (NPMRDS). This data can add value across transportation planning and policy-making. At EBP, we think it extends the potential for informed economic analysis.